Drawing from the extensive data collection at Eurostat, this publication offers insights into the structure, conduct, and performance of businesses within the EU. From sector-specific analyses to emerging trends in the EU's business economy, the publication aims to present a balanced set of indicators. We will focus on specific numbers concerning Luxembourg and highlight its unique position.
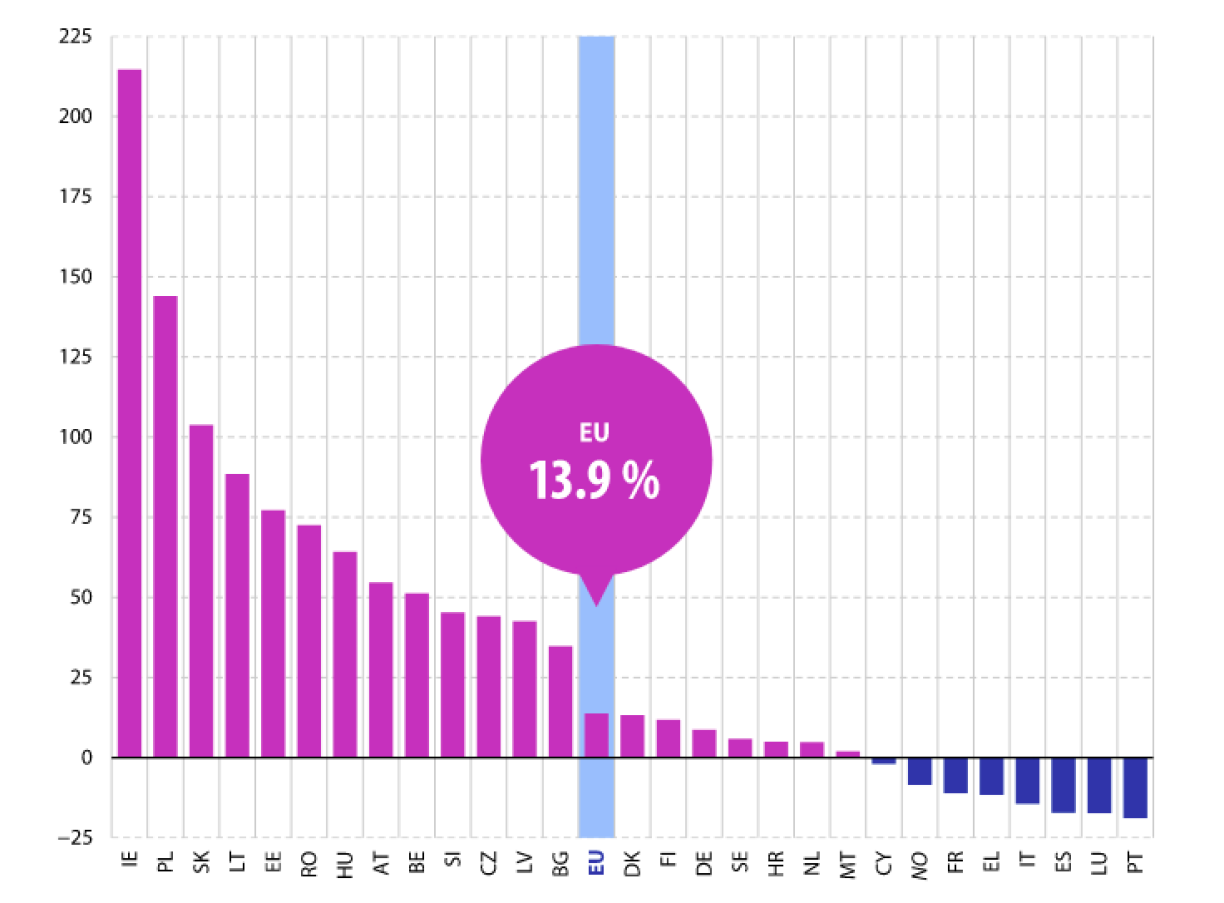
Examining the period from 2005 to 2022, it's essential to consider the impact of global financial crises and subsequent recoveries.
The overall change in the industrial production index for Luxembourg during this period saw a decrease of 17.3%. In 2022, Luxembourg's industrial production was 13.9% lower than it was in 2005. Conversely, Ireland, Poland, and Slovakia experienced the highest growth rates, with their industrial output more than doubling from 2005 to 2022.
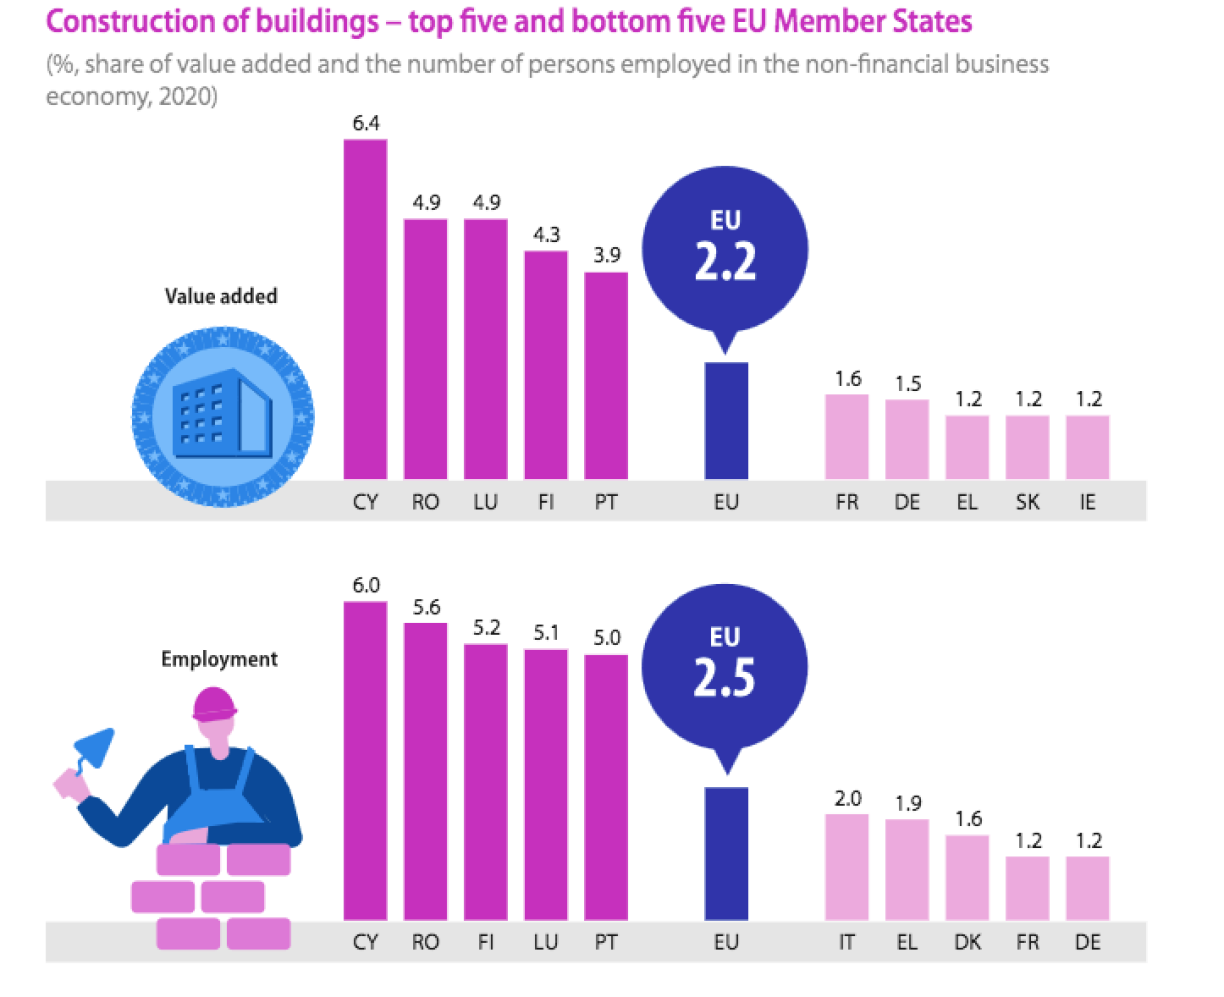
In 2020, the construction of buildings contributed 2.2% of value added in the EU's non-financial business economy and employed 2.5% of the workforce. Luxembourg stands out in this sector, reflecting its relatively high share compared to the EU average.
In terms of value added, Luxembourg, Cyprus, and Romania had more than double the share of the non-financial business economy compared to the EU average. Similarly, in terms of employment, Cyprus, Romania, Finland, Luxembourg, and Portugal had a share double or more than the EU average. This indicates various factors driving demand, including population growth and construction activities related to tourism.