Our French colleagues at 5Minutes had a look at how prices have developed in Luxembourg between the years of 2000-2019 using data from Eurostat, and we published a translation of their article yesterday.
What they found was that a majority of prices of common goods and services have gone up considerably over the last 20 years, with some categories more than doubling in price. Our readers were quick to ask how this price increase relates to increases in wages, which is a fair question.
So we set out to answer that as best possible given the data available through Statec. Here's what we found.
The first thing we looked at was how the increase in prices of commonly purchased goods and services compares to the median/mean increases to the average household disposable income.
For this we used data from 2003-2017 (as this is the only data available through Statec for median income). The chart below shows income increases (median/mean) in green, products/services that have decreased or increased by less than disposable income in blue, and those that have increased by more in red.
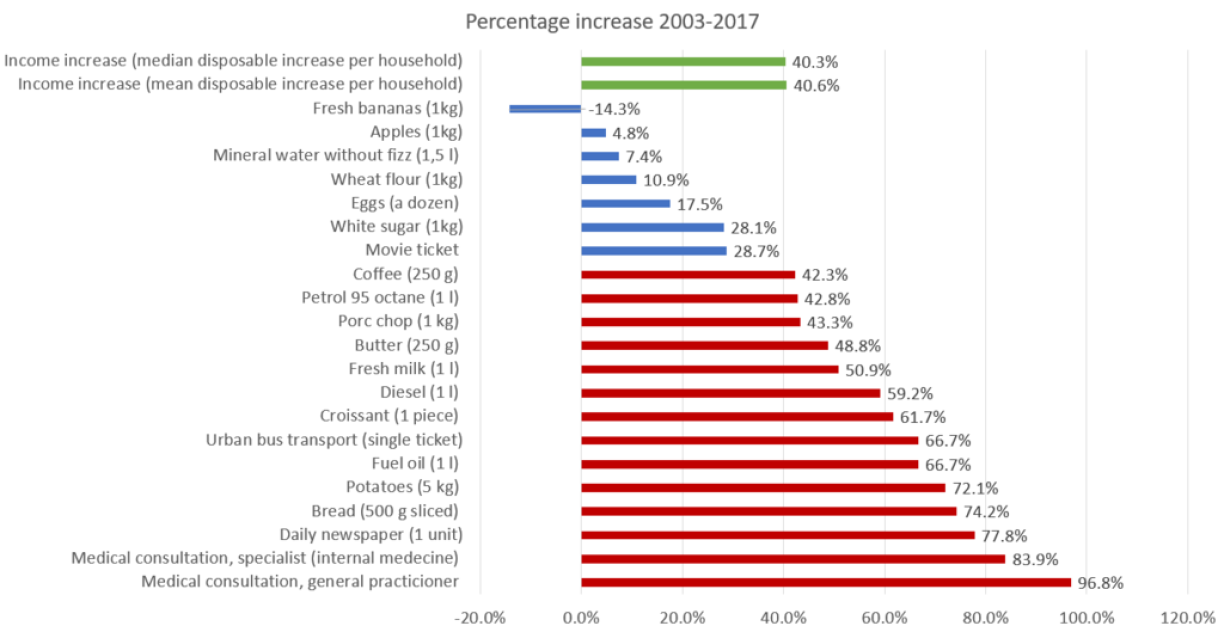
As you can see, 14 out of 21 categories increased by more than average disposable household income, though some only just. Medical consultations saw the biggest relative increase, while bananas actually dropped in price.
We also looked at price evolution as compared to that of the social minimum wage, using data spanning 2006-2019. The colours used here remain as above.
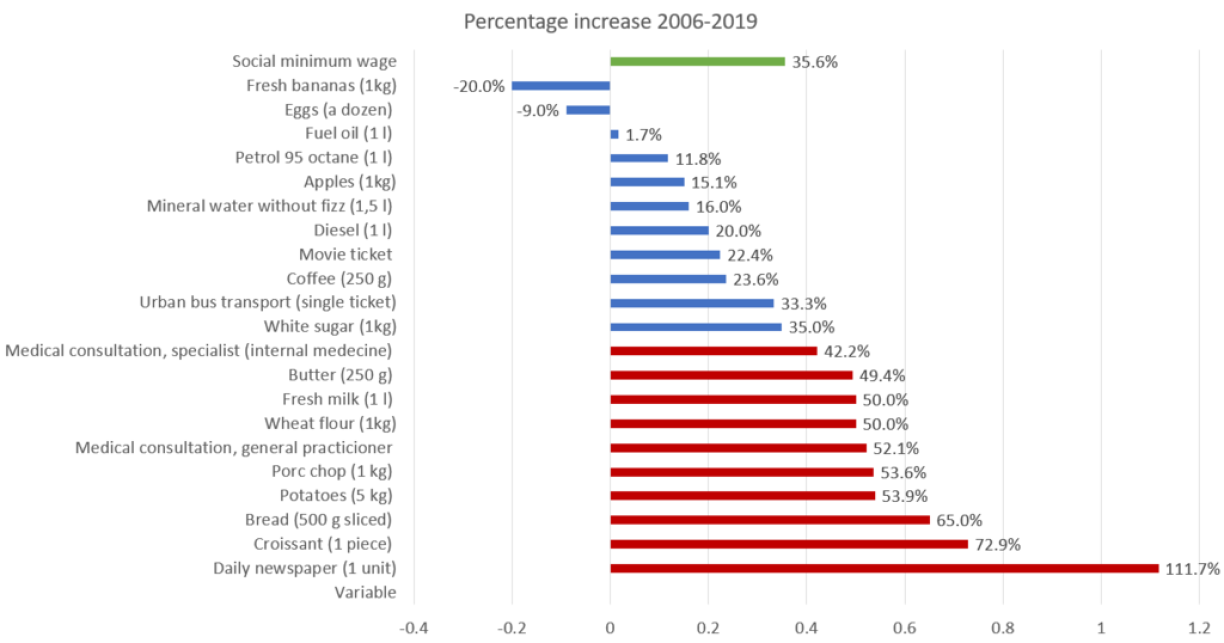
Here we can see that 10 out of 21 categories increased more rapidly in cost than did the social minimum wage, most notably the price of a newspaper, croissants, bread, and potatoes - while both fresh bananas and a dozen eggs went down in price over the period.
If you are wondering why the price of a medical consultation is not at the top of this list, it's because our reference times for the two categories (social wage/household income) are different. The cost of a medical consultation went up by 36% between 2004 and 2006.
Another interesting measure to look at is Statec's data on how household budgets are spent. To get a comparison that aligns with the other data we looked at, we opted to see how expenditure in various categories developed between 2005 and 2017 - again this is because the data ranges available vary, so unfortunately we can't use the exact same time span as above.
The green "total" here is the overall change in household expenditure over the time span. Blue denotes that expenditure in a category has grown at a rate lower than overall household expenditure, while red denotes faster expense growth. Note that the percentage shows how much more/less is spent in a given category between the two years, not in proportion to overall expenditure.

So we spent 9% more on food and beverages in 2017 than we did in 2005, but overall household expenses went up by 21.3%. We spent less on clothing, tobacco, and transport, but substantially more on education, rent, utilities, and communication.
How have Luxembourg's prices changed in the last 19 years?
Martin Jonsson: "Let me save you some time: they have it in Auchan."
Martin Jonsson: While other countries move away from shopping centres, we build more - but why?


