The EU average decreased by 0.1 points from 7.3 in 2018 to 7.2 in 2021 (on a scale from 0 for very dissatisfied to 10 for very satisfied), Eurostat data shows. Despite the decrease, the figure is still high above the 2013 average of 7.
In Luxembourg, residents give their life satisfaction a mark of 7.4, down from 7.6. Only 12% said their satisfaction was 'low', while 61.7 said it was 'medium' and 26.3% saw it as 'high'.
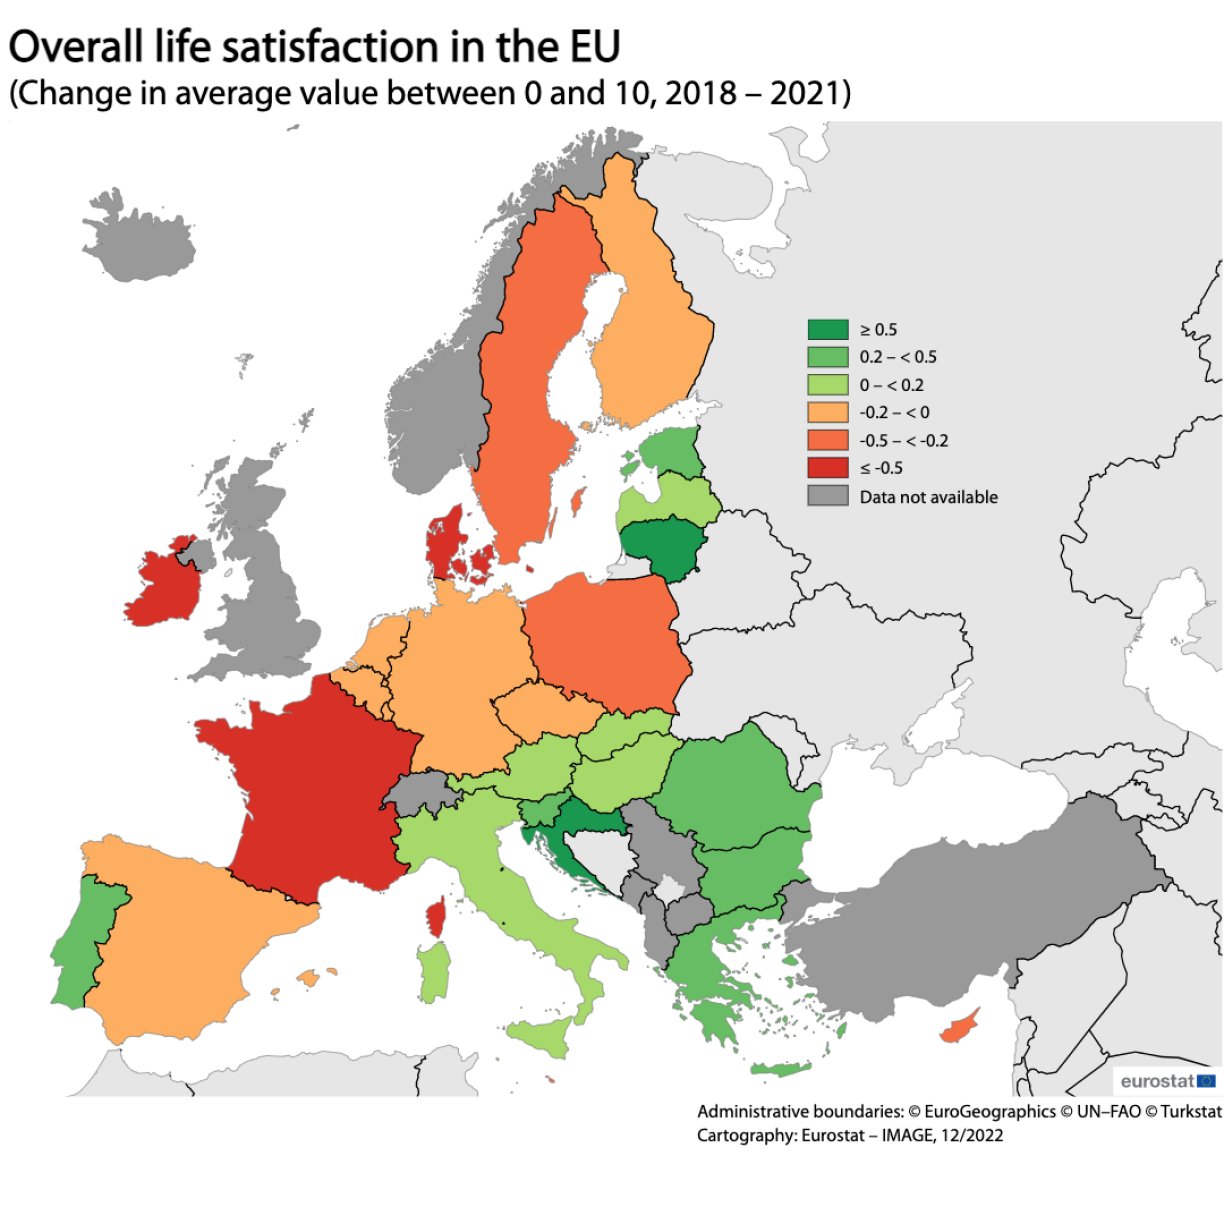
In Germany the number is 7.2 (down from 7.4) and in Belgium 7.5 (down from 7.6). France saw quite a sharp drop: From 7.3 in 2018 to 6.8 in 2021. The biggest drop was recorded in Ireland, which went from 8.1 to 7.3.
In 2021, life satisfaction was highest in Austria (8), Finland (7.9), Romania (7.7) and the Netherlands (7.6) and lowest in Bulgaria (5.7). The biggest increases were seen in Lithuania (+0.6) to 7, in Croatia (+0.5) to 6.8, and in Greece and Romania (+0.4 each) to 6.8 and 7.7, respectively.
The analysis is based on the 8+1 dimensions of quality of life, which is a framework for the measurement of wellbeing. They include material living conditions (income, consumption, material conditions), leisure and social interactions, economic security and physical safety, governance and basic rights, environment, and overall life experience.
A recent Politmonitor study concluded that while the vast majority of Luxembourgers (79%) believe that their financial situation is currently good, more than a third of the population (37%) admit that it has worsened, or even significantly worsened, over the past six months.
Concerns over security in Luxembourg have grown more than any other aspect. In May 2022, 30% of participants indicated that security was a concern; in November, this percentage reached 43%. However most voters in Luxembourg remain concerned about the access to affordable housing.
Women were, on average, slightly less satisfied with their lives than men: 7.2 and 7.1, respectively, but this figure decreased by -0.2 for both sexes.
Another conclusion drawn from the data is that life satisfaction decreases with age. For the age group 16-29 year, the level of satisfaction was 7.5, whereas it was 6.9 for over 65-year-olds.
A higher level of education also generally added life satisfaction to those surveyed.
For more infographs on life satisfaction per category and country, have a look at this interactive website.


